Volcano PLot
Description
A volcano plot is a type of scatter-plot that is used to quickly identify changes in large datasets composed of replicate data. It plots significance versus fold-change on the y- and x-axes, respectively. A volcano plot combines a statistical test (e.g., T-test, ANOVA) with the magnitude of the change enabling quick visual identification of those data-points (genes, etc.) that display large-magnitude changes (over a Fold threshold) that are also statistically significant (under a P-value). For more information, see Wikipedia: Volcano_plot, Anova and T-test
Usage

| Field | Description |
|---|---|
| Launch | Field indicating whether you want to execute this analysis in the workflow (checked) or not (unchecked). |
to finish …
Output Examples
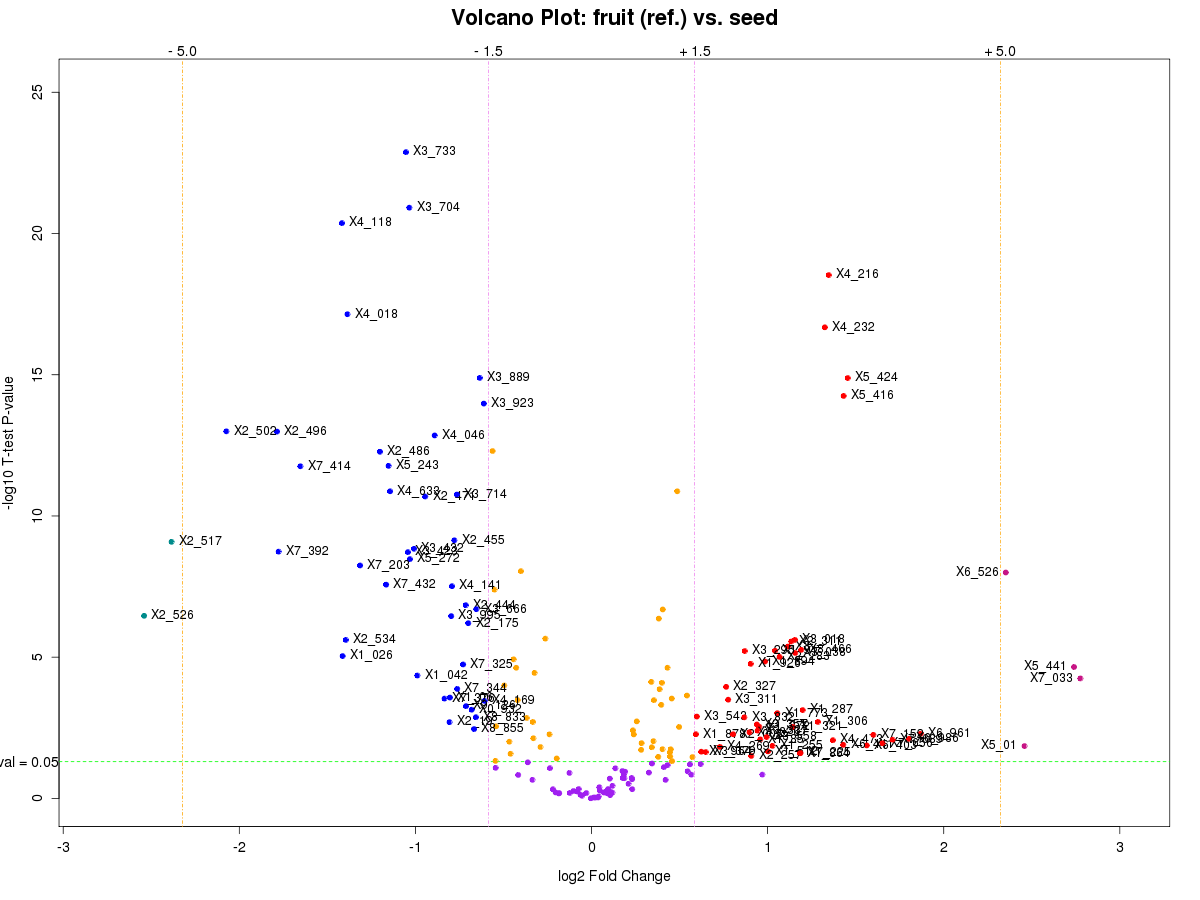
Fig 1. legend
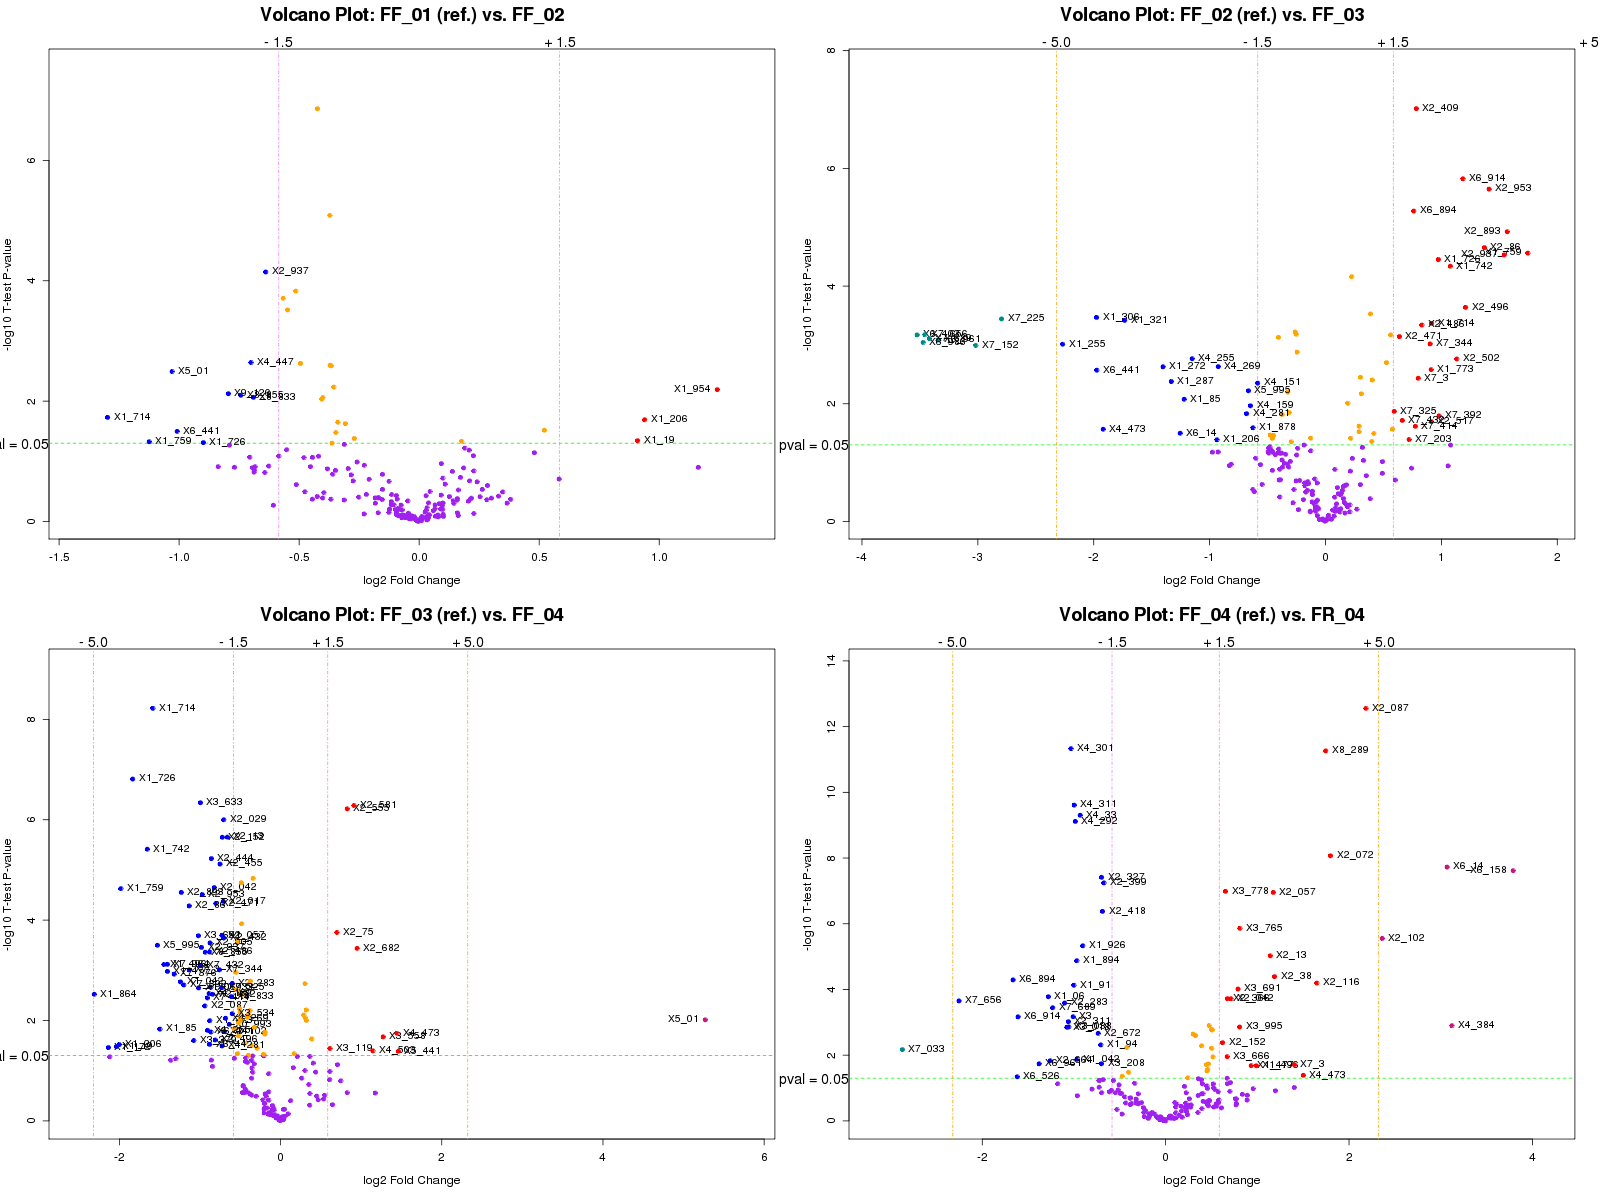
Fig 2. legend
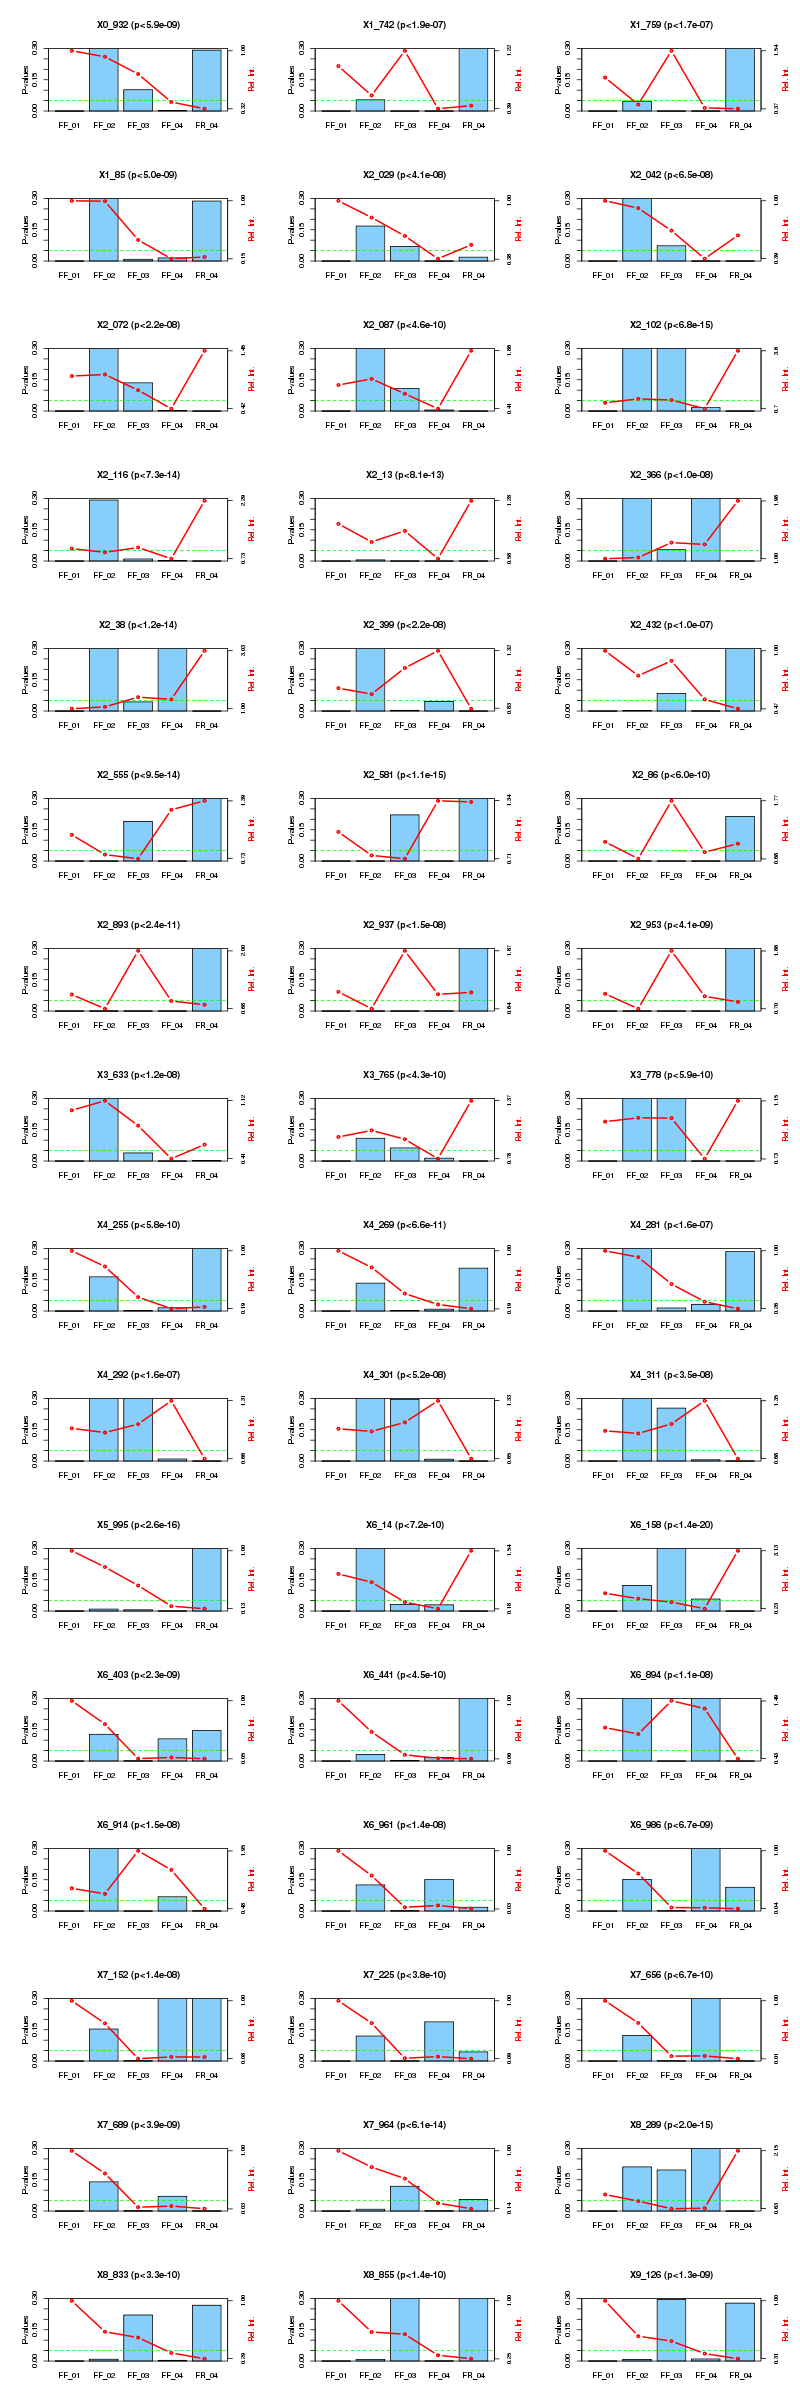
Fig 3. legend